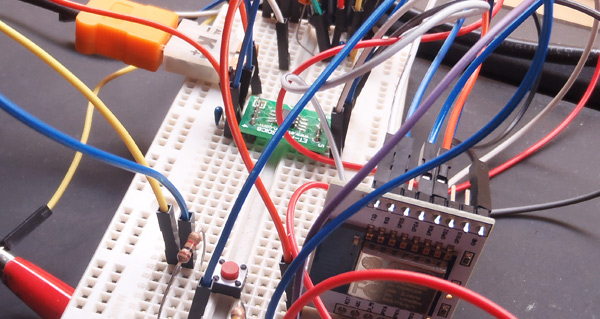
Welcome! The above plots are live temperature streams from my apartment. How does one achieve this? Well that is what will be explained in this blog post. As all hobby projects start, undoubtedly one begins with elegantly executed and orderly hardware design.

After you get over the amazing architecture of the design, you may notice the hardware involved. The primary hardware involved is the ESP8266 Wifi SoC, a MAX6675 SPI thermocouple IC, and a thermocouple. This marks my first project with the ESP8266 and I thought streaming data to my website would be a fun place to start. The reason i’m using a thermocouple is sadly I don’t own a single thermistor. This was unfortunate as I had to get SPI up and running on the ESP8266. Anyhow, i’m assuming you can imagine the hardware design in your head and I won’t bore you with further details regarding that.
How does the software work?
The above image attempts to show how all the software works. Firstly, the ESP8266 sends TCP packets to a wifi router. These TCP packets are formulated as HTTP Post request packets. The wifi router exposes these packets to the WWW and these packets are sent specifically to a PHP file on my server. The PHP file parses the post request and saves the data to a JSON file. This JSON file can then be distributed to viewers with web code such as HTML,CSS,Javascript,AJAX. AJAX/Jquery is used to fetch the JSON file and HTML/CSS/Javascript is used to make the plot visible and purty.
Further explanations and code examples WIP
….
